Scenario: Analyze 6 Quark Matter EOS Models
Analyze 6 EOS files with color-superconducting quark matter (CSC and RGNJL series from arXiv:2411.04064). The RGNJL tables are from the RG-NJL-EoS-tables repository.
Step 0: Get Batch Example Files
The batch files are included with tovx-demo:
tovx-demo
This downloads 18 files total:
- 3 basic examples:
test.csv, hsdd2.csv, csc.csv - 6 batch EOS in
inputCode/Batch/ (ready to use in code units) - 6 raw batch EOS in
inputRaw/batch/ (for unit conversion tutorials) - 3 raw versions in
inputRaw/
Step 1: Batch Convert to Code Units (Optional)
Note: Batch files are already in inputCode/Batch/, so you can skip to Step 2. This step is only if you want to practice unit conversion.
Convert all 6 raw batch files simultaneously:
# Via pip
tovx-converter --batch inputRaw/batch/ --pcol 2 --ecol 1 --system 3 --workers 6

# From source
python -m tovextravaganza.cli.converter --batch inputRaw/batch/ --pcol 2 --ecol 1 --system 3 --workers 6
Parameters: --pcol 2: Pressure is in column 2, --ecol 1: Energy density is in column 1, --system 3: Units are fm⁻⁴, --workers 6: Use 6 parallel workers
Result: All files converted to inputCode/Batch/ in ~2-5 seconds
Step 2: Batch Compute M-R Curves
Compute M-R sequences for all 6 EOS files:
# Via pip
tovx --batch inputCode/Batch/ -n 1000 -o export/batch_all --workers 6

# From source
python -m tovextravaganza.cli.tov --batch inputCode/Batch/ -n 1000 -o export/batch_all --workers 6
What happens:
- For each star, automatically interpolates all EOS columns at the central pressure
- Saves not just M, R, Λ, k₂ but also central energy density, number density, phase labels, etc.
- Lets you track how interior conditions (density, phase transitions) vary with stellar mass
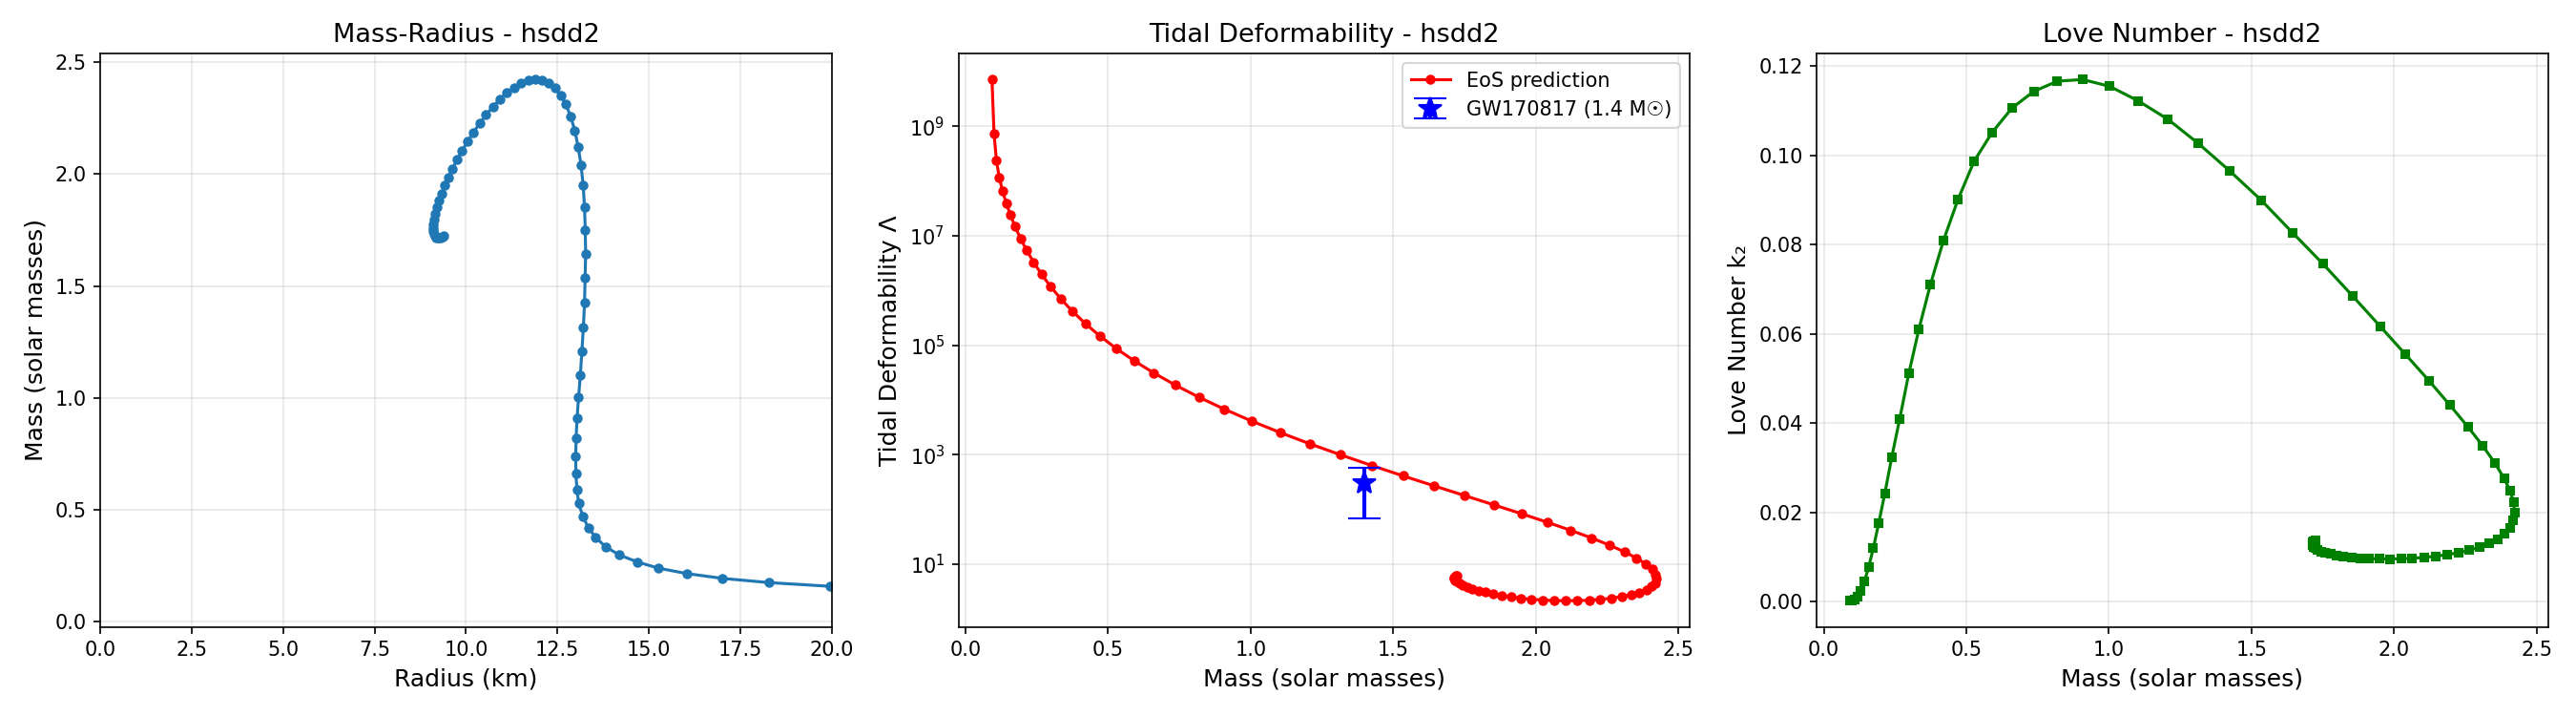
Output: 6 CSV files with ~250-1000 stars each (R < 99 km filter), Each CSV includes: p_c, R, M_solar, Lambda, k2, central_e, central_n, central_phase, ..., 6 sets of M-R, Λ(M), k₂(M) plots, Completed in ~30-60 seconds (parallel processing!)
Results Summary:
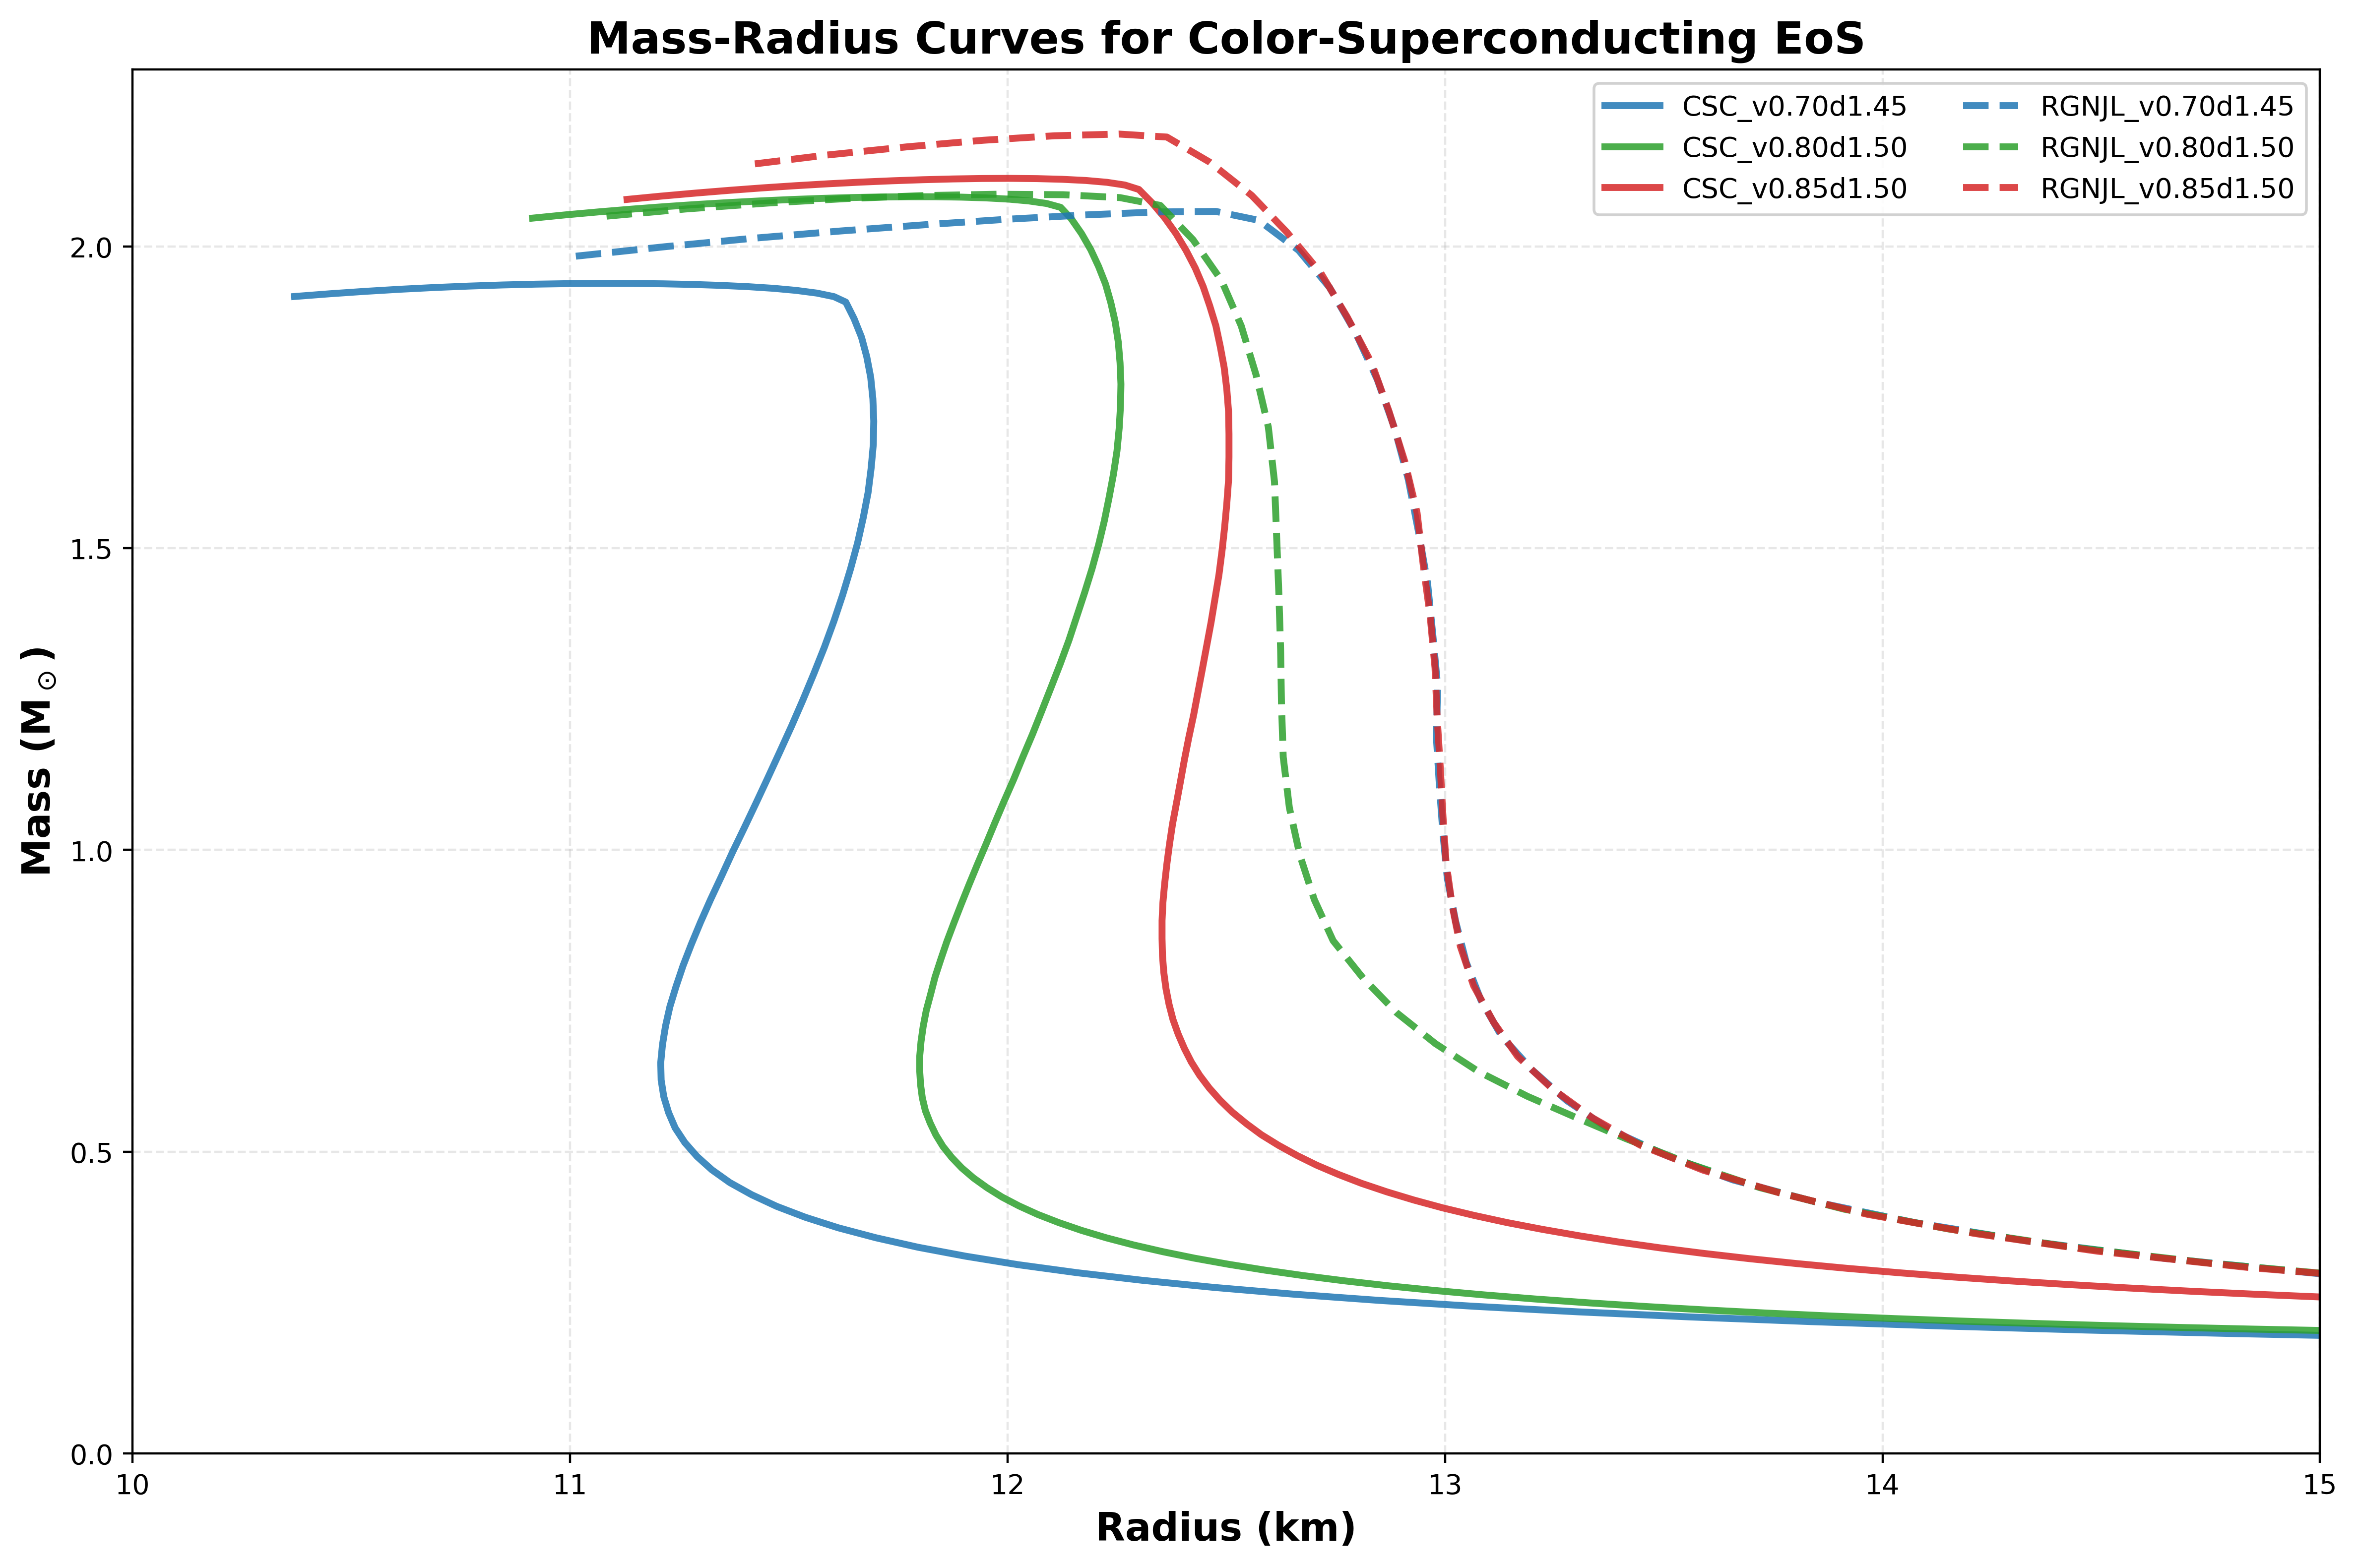
CSC_v0.70d1.45   => M_max = 1.94 M☉
CSC_v0.80d1.50   => M_max = 2.08 M☉
CSC_v0.85d1.50   => M_max = 2.11 M☉
RGNJL_v0.70d1.45 => M_max = 2.06 M☉
RGNJL_v0.80d1.50 => M_max = 2.09 M☉
RGNJL_v0.85d1.50 => M_max = 2.19 M☉
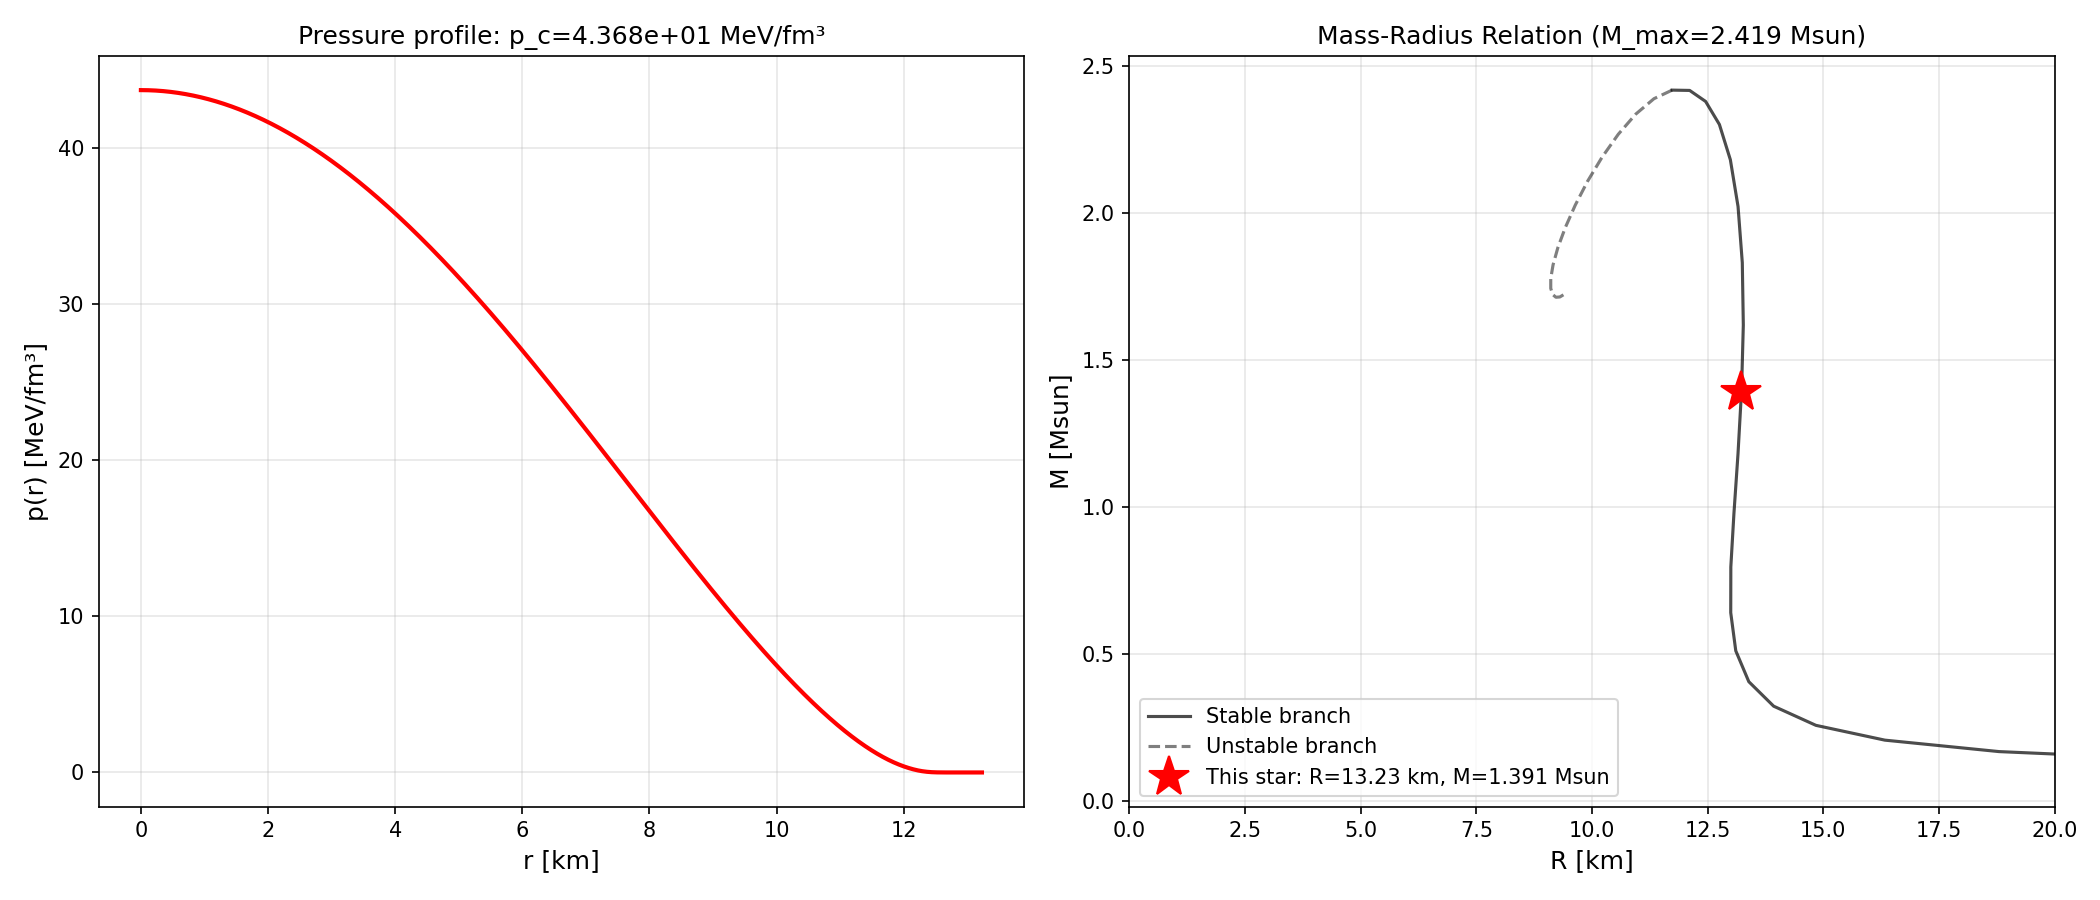
Step 3: Batch Radial Profiles at Maximum Mass
Generate internal structure profiles at M_max for all 6 EOS:
# Via pip
tovx-radial --batch inputCode/Batch/ --max-mass -o export/radial_maxmass --workers 6

# From source
python -m tovextravaganza.cli.radial --batch inputCode/Batch/ --max-mass -o export/radial_maxmass --workers 6
What happens:
- Each EOS: Fast M_max search (50 coarse + 200 fine = 250 TOV solves)
- Finds M_max with precision < 0.01 M☉
- Computes full radial profile with automatic interpolation of all EOS columns at each radius
- Saves everything to HDF5 (or JSON) - complete radial data for post-processing
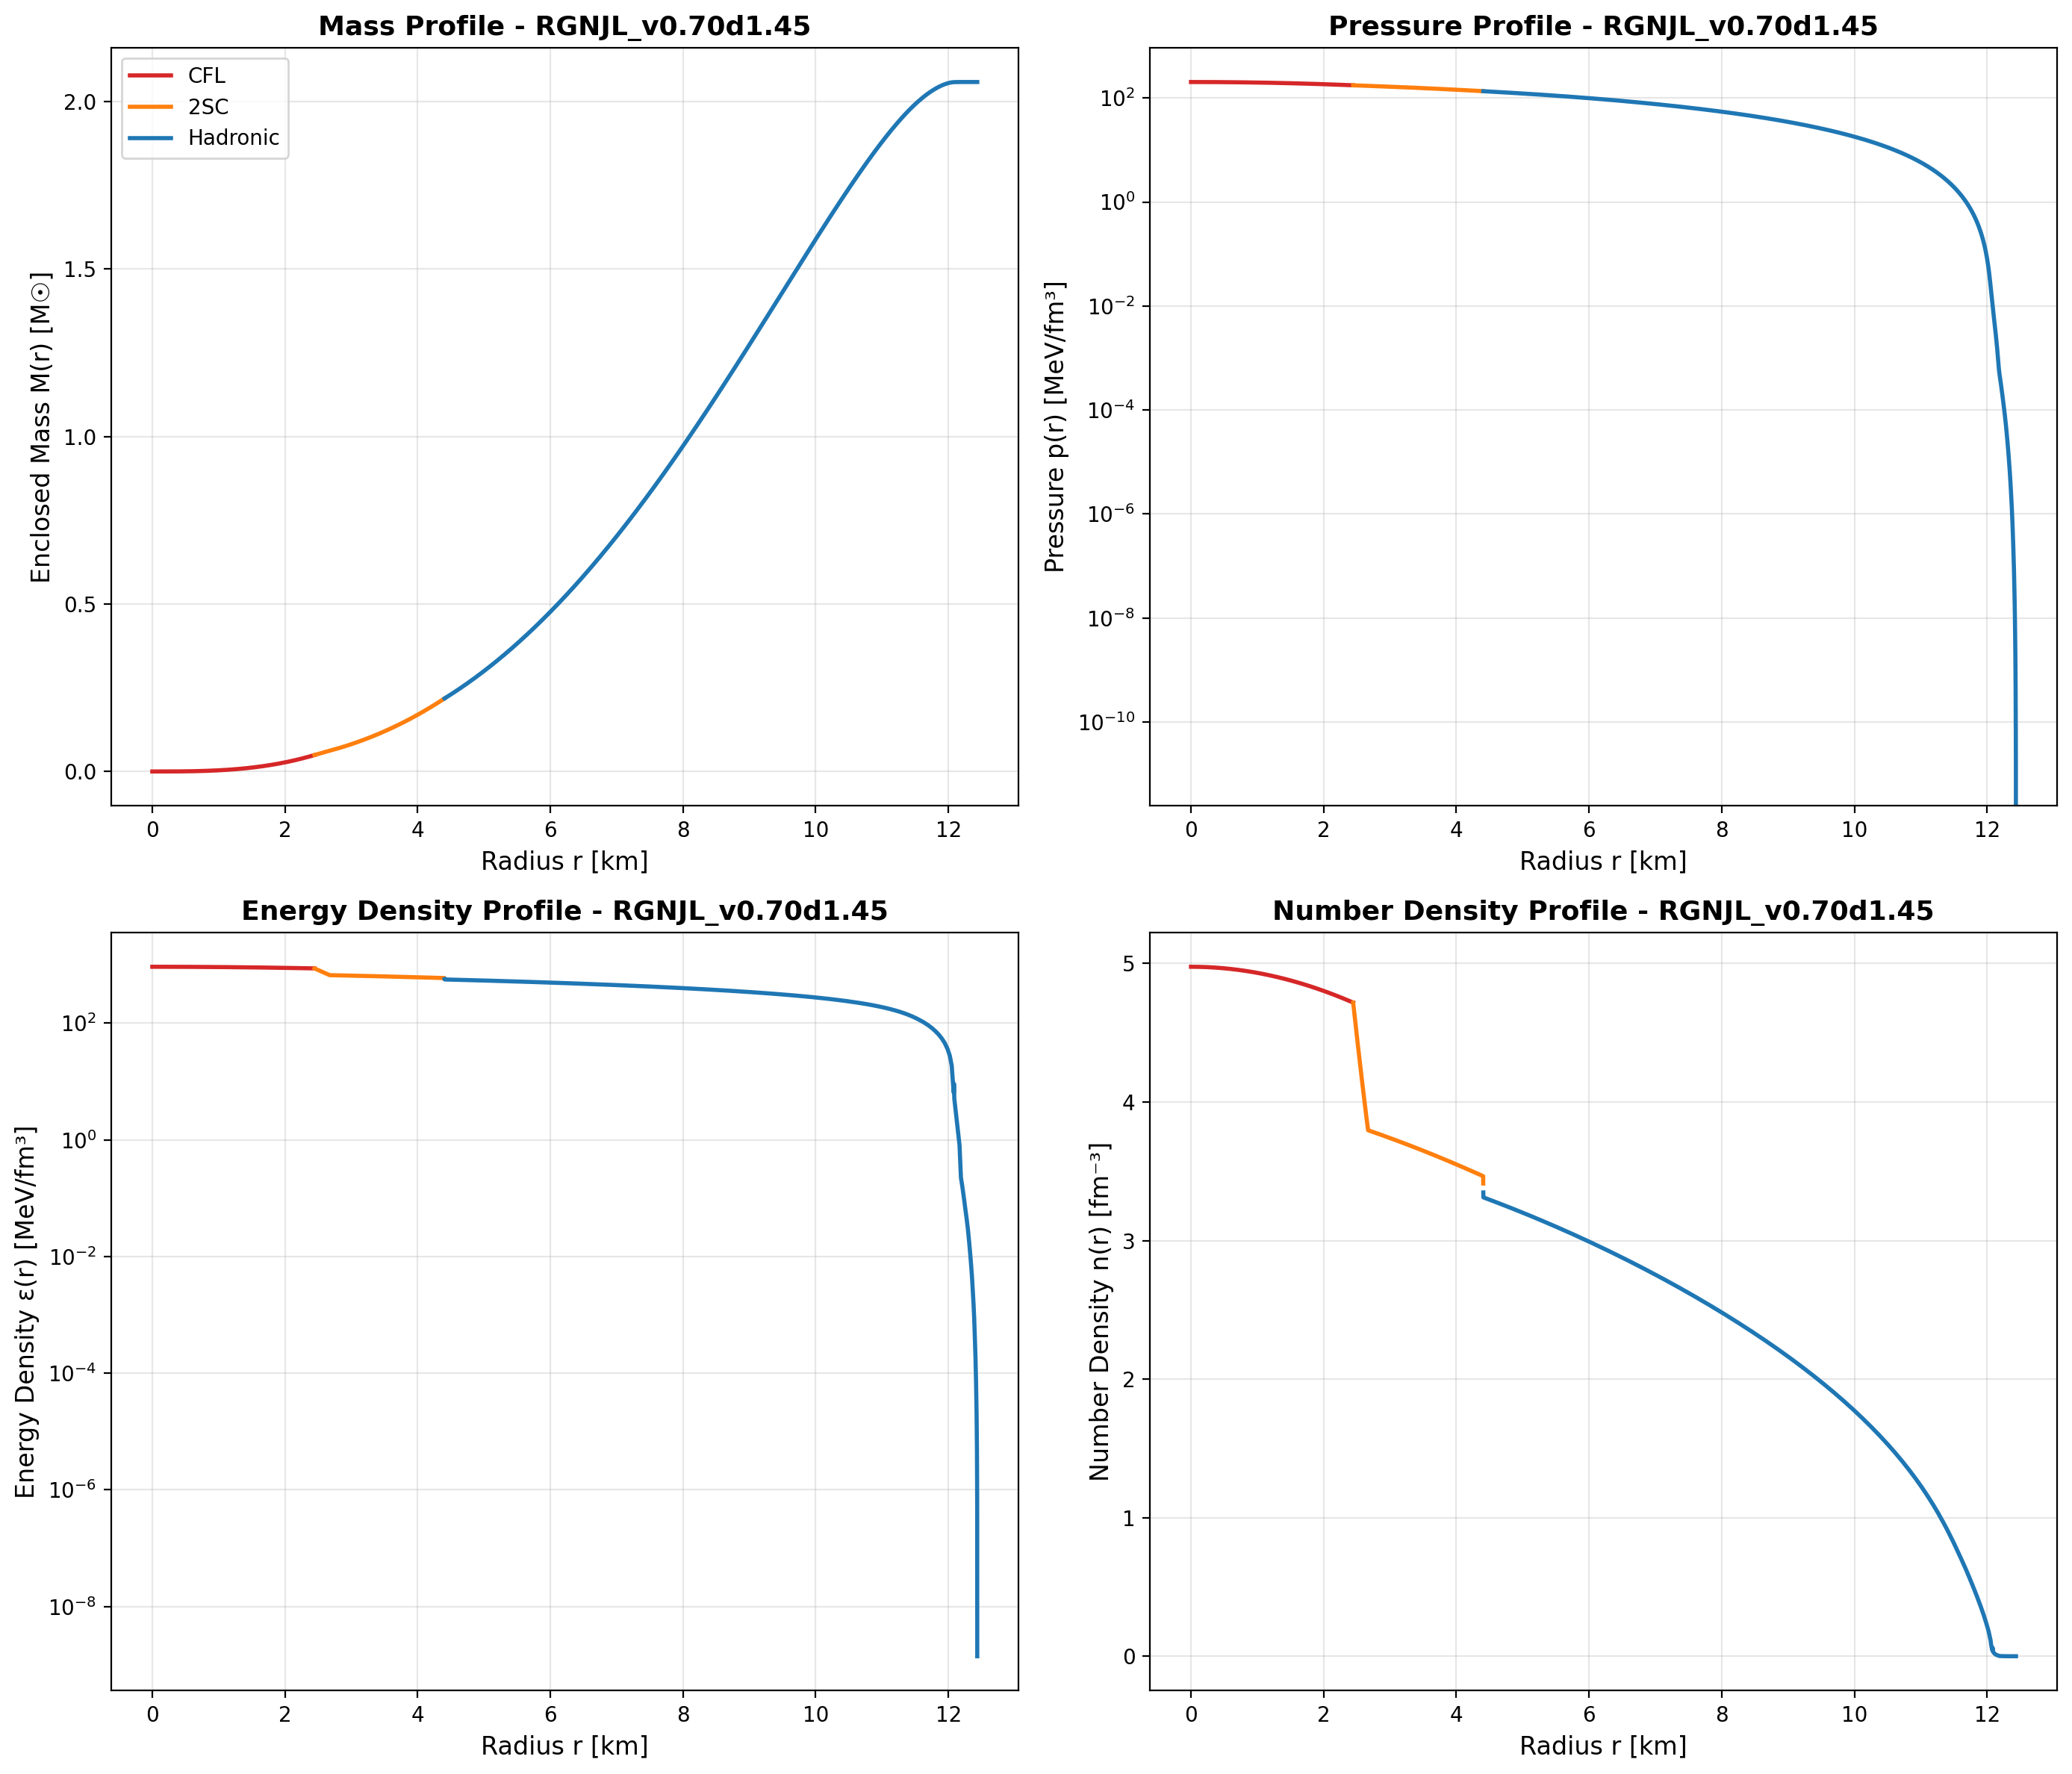
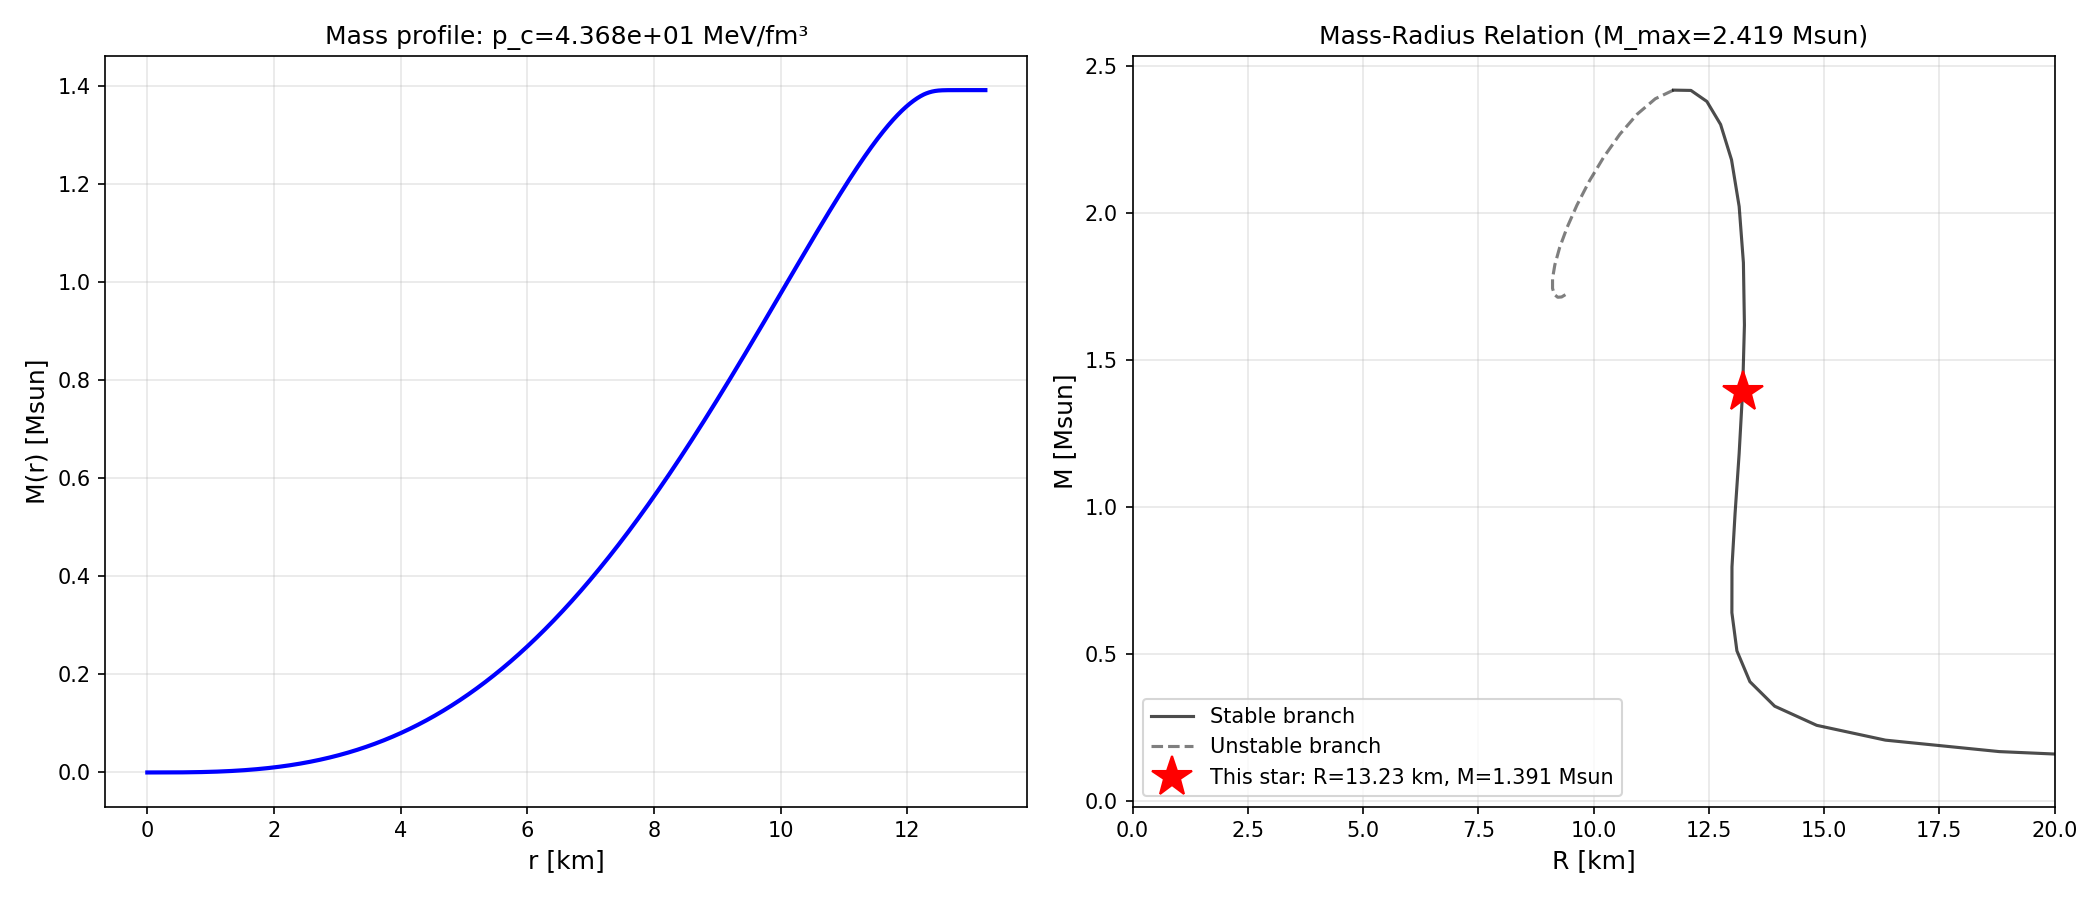
- Generates M(r) and p(r) plots with M-R context
Output: 6 HDF5 files in export/radial_maxmass/*/json/*.h5 with complete radial data, 12 plots (Mass and Pressure profiles for each EOS), Total time: ~30 seconds for all 6 files in parallel!